Ford Stock: The Yield Curve Says It All
Ford #Ford


YuriyVlasenko/iStock Editorial via Getty Images
We’ve argued for a while now that Ford’s (NYSE:F) stock is set for a downturn. Initially, we were wrong and got quite a bit of stick from readers. However, as time passed, our analysis came to fruition.
With Ford stock reaching multi-year lows, many investors might be looking to buy into the bottom, but we’d like to reiterate the fact that past price isn’t an indicator of future price when looked at in isolation. We think Ford stock will experience further downturns before it reaches a tradable level; here’s why.
Economic Headwinds For Durable Goods
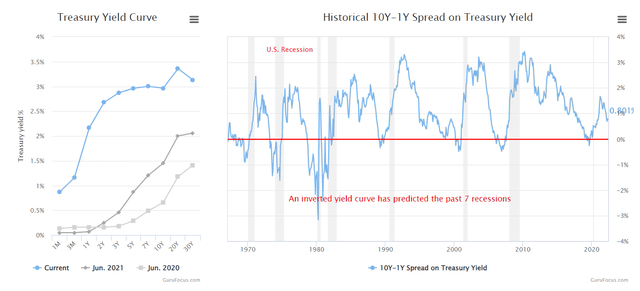
I’m going to base my economic inferences on the yield curve and the spread between long-dated and short-duration treasury bonds.
First of all, the upward sloping yield curve exhibits implied interest rates of more than 3%. Whether the rates come to fruition or not is debatable. In addition, the spread between the 10-year and 1-year is very much near breakeven, implying an unequal distribution between long and short term rates.
In essence, what the yield curve tells us is that there will likely be contractionary monetary policy in the short run, which could send us into major economic trouble, subsequently requiring a decrease in interest rates.
If the yield curve and spread pan out, we’ll possibly see headwinds arise in the durable goods space. Durable goods with lifecycles surplus of three years aren’t core to our everyday living standards. Thus, a waning economy causes cyclicality in the durable goods space, such as vehicles.
Furthermore, Ford sells a financed product. With the potential increase in interest rates, financed durable goods will likely take a back seat among consumers for years to come.
Gurufocus
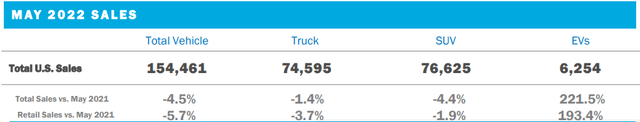
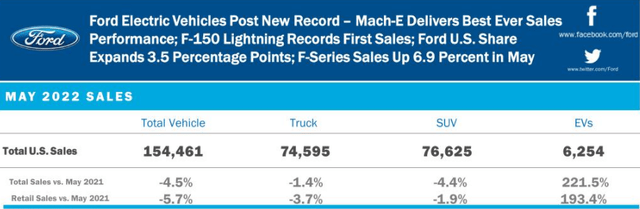
Now that I’ve covered my economic outlook, I’d like to intertwine it with Ford stock. Ford’s May report shows that its U.S. sales dipped by 4.5%. I’m aware that its electronic vehicles sales surged by 2.22x year-over-year, but the secular growth we see in that department can’t be substantiated just yet. To contextualize, Ford’s latest 8-K report conveys that EVs only make up 4.05% of its North American sales.
Don’t get me wrong. I love the new F-150 lightning. However, for Ford to pivot from an internal combustion vehicle enterprise to an EV will probably require a lot of restructuring costs, and it would require a lot of consumer EV uptake. Also, I certainly can’t see the latter happening in the current economic environment.
Ford
Ford
Rivian Investment
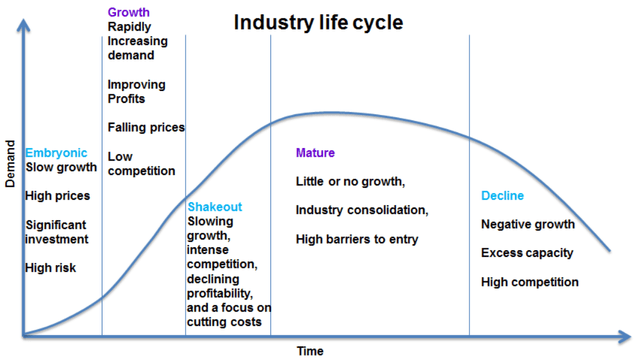
I’m not going to speculate on how Ford’s $5.4 billion Rivian (NASDAQ:RIVN) loss can be recouped. The observation I’d like focus on regards industry maturity—Ford’s part of a mature industry with little growth (except for EV segments). The company’s Rivian investment was a sign of the firm’s strategy to invest externally to sustain growth. This is a typical move by mature companies as the mature phase is usually characterized by a shake-out stage, leading to many mature firms investing in alternative industries or re-financing to expand horizontally.
Analyst Prep
I’m not saying that it’s a bad thing that Ford’s investing externally. Instead, I’m arguing that its stock isn’t systemically supported, and the start of its external investment process is questionable.
Relative Valuation
Relative valuation exists to compare a stock to its peers or alternatively to its historical value. I decided to cover historical value here as it accounts for cyclicality. Thus, we’ll be observing matters on a normalized basis.
At face value, Ford looks excellent with a price-to-sales below 1.00 and a price-to-earnings well below the S&P 500’s (22.4x). However, it’s only when we account for company-specific cyclicality that it becomes clearer.
First of all, Ford’s P/E ratio is trading at a 47.59% premium to its 5-year average, suggesting that it’s at a cyclical surplus. Furthermore, the company’s price-to-sales looks glamorous in isolation, but a 36.55% normalized surplus suggests otherwise.
Finally, the firm’s price-to-book can be considered at face value as it’s a threshold-based metric. The famous financial academic, Eugene Fama discovered in 1993 that value stocks exhibit the best risk/return prospects. Fama declared that stocks are considered valuable when they have book values lower than the market average. Thus, Ford’s price-to-book of above 1.00, exceeds the threshold and is deemed overvalued.
Metric Value P/E Non-GAAP 10.85 Price/Sales 0.41 Price/Book 1.24 A Potential Bull Case
The chart below shows Ford’s market share in North America alone. I couldn’t find any credible sources for its global market share. Nonetheless, using the firm’s North American market share provides a solid indication of its broad based operations.
Ford could persevere through an economic downturn as its robust market share provides it with bargaining power over its suppliers and pricing power in the market, in turn making my bearish claim obsolete.
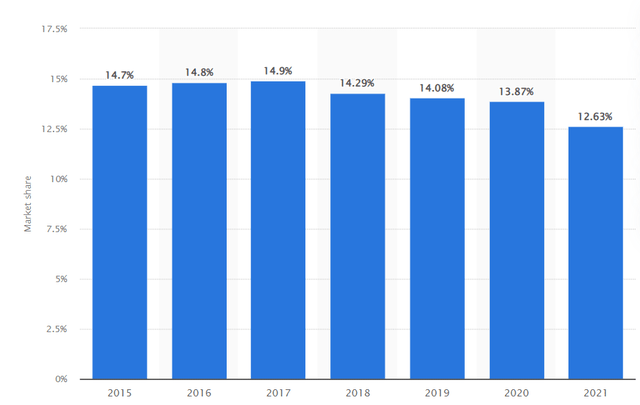
Statista
Furthermore, Ford’s stock price is something to keep an eye on. This high-quality company has lost more than 35% of its market value since the turn of the year. Thus, we could argue that the stock’s price has bottomed out, and we could see a recovery soon.
The Bottom Line
Cyclicality will probably get the better of Ford for the time being. The company does hold a solid market position, and there’s a fair argument that Ford stock could be oversold. However, the yield curve and relative valuation metrics suggest that going long on Ford is a bad idea at this stage.