Chips Made In The USA: Buy Texas Instruments Instead Of Intel
Chips #Chips


HUNG CHIN LIU
Semiconductors are a hot topic right now – debates between too much or too little capacity, technological innovation and technological sovereignty of entire countries. One thing is sure: Semiconductors will shape our future and drive innovation for decades to come. Intel (NASDAQ:INTC) is one of the most discussed semi-stocks in the market, but I believe it is not the best choice to benefit from technological sovereignty. In this article, I’ll explain why Texas Instruments (NASDAQ:TXN) is the better choice.
Technological Sovereignty
On its recent investor day, ASML (ASML) estimated that by 2030 around 10% of total wafer installed capacity will be inefficient due to countries pushing for local manufacturing. Several countries pushed large incentive packages to achieve the goal of technological sovereignty:
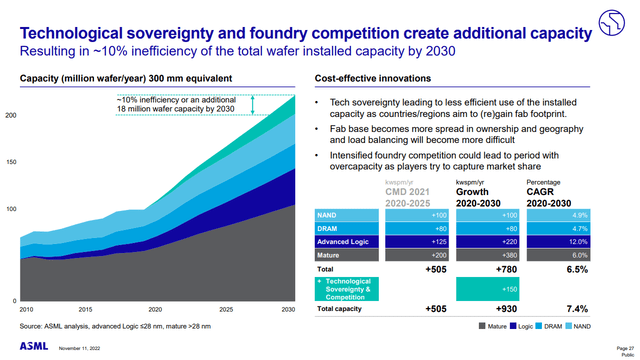
Tech Sovereignty increases semi demand (ASML Investor Day 22)
Intel comes up most as a beneficiary of the US Chips Act. According to Intel, the company operates 15 wafer fabs in 10 locations. Three are in the US, the rest in Europe, China (one fab and two testing and assembly sites), Malaysia, Vietnam and Costa Rica.
Texas Instruments has twelve wafer fabs, with the majority in the US and more limited exposure to China.
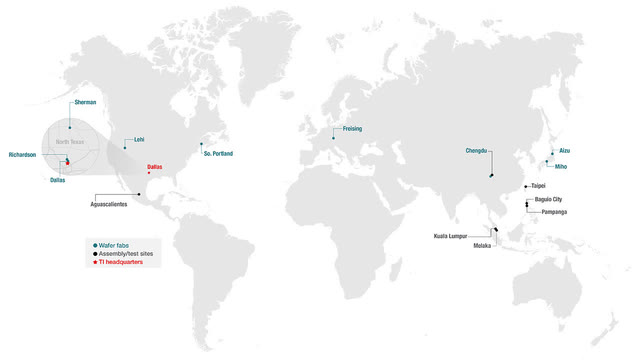
Texas Instruments manufacturing footprint (TI.com)
TI is a Superior Business
Texas Instruments has a much more asset-light business model. The significant difference between the two companies is that TI manufactures Analog Chips while Intel manufactures Digital Chips. We can see that Intel requires a much higher CapEx than TI, even though TI has also ramped up CapEx (more on that later). TI also produced much higher and rising margins, while Intel has seen margins plummet in recent years due to a switch in business models. This led to TI’s phenomenal ten-year median ROIC of 23% versus Intel’s 12%. In my recent article about TI and Nvidia (NVDA), I went into detail about why I prefer the Analog or Mature Chip industry.
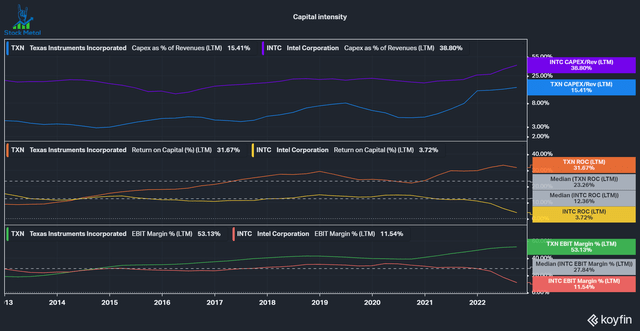
Capital intensity (Koyfin)
Another advantage of the Analog business model is the high returns on R&D. Analog chips often have a much more prolonged use so that the R&D investment can amortize over a much longer time. TI still sells some Chips they developed 30 years ago (at 90% gross margins)! Meanwhile, Digital Chips are constantly racing to get smaller, faster and more energy efficient. This also means that built capacity needs to be upgraded or retired much sooner, making the whole business much more capital-intensive. Below is a chart with the last five years to showcase the difference between the two businesses.
FY 18 FY 19 FY 20 FY 21 LTM Intel R&D Expense $13.543 $13.362 $13.556 $15.190
$17.113
Intel CapEx $15.181 $16.213 $14.453 $20.329 $26.983 Intel Operating Cashflows $29.432 $33.145 $35.384 $29.991 $13.668 TI R&D Expense $1.559 $1.544 $1.53 $1.554
$1.625
TI CapEx $1.131 $0.847 $0.649 $2.462 $3.112 TI Operating Cashflows $7.189 $6.649 $6.139 $8.756 $9.035 Click to enlarge TI operates in superior industries
Once again, I’d like to look at a slide from ASML’s Investor day. The company estimates a 9% CAGR for the overall semi-market through 2030. Notable segments are Automotive (14%), Datacenters (13%) and Industrial (12%) as the fastest growers and Personal Computing (3%) is by far the slowest grower.
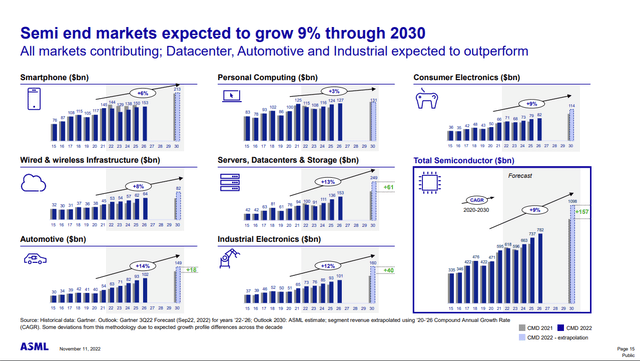
Semi growth by end market (ASML Investor Day 22)
Let’s look at the sales mix for both companies (FY 2021 numbers). For Intel, I’ll only look at their two largest segments, Client Computing (51.3%) and Datacenters (32.6%), because they represent the large majority of the sales mix. For Texas Instruments, I’ll only look at Industrial (41%), Personal Electronics (24%) and Automotive (21%) for the same reason.
Sales mix percentage Expected Growth Intel Client Computing 51.3% 3% Intel Datacenters 32.6% 13% TI Industrial 41% 12% TI Personal Electronics 24% 3-9% TI Automotive 21% 14% Click to enlarge
We can see that Intel’s largest segment is expected to grow just 3% per year. Datacenters are 1/3 of Intel’s business and a rapidly growing industry, but Intel is losing market share. As a proxy, I’ll use an article on the top 500 supercomputers and which chips they use: We can see that Intel is still the dominant player, with 388/500 supercomputers using Intel chips, but this number is down from 464. Meanwhile, AMD (AMD) went from 6 to 93 in just five years. This again showcases the competitiveness of digital semis.
In contrast, Texas Instruments has most of its business in Industrial and Automotive, some of the most attractive end markets. The company has been driving this shift for many years and has been very public about the attractiveness of these industries. Management was a thought leader here and steered the company in the right direction.
TI has Superior Management
Both companies are currently in a major investment cycle. The large difference is that TI has a much higher certainty of high returns on its CapEx. According to Rich Templeton (TI CEO), each new fab will generate about $5-6 billion in revenues annually.
Yes, I go ballpark because these things always depend on what you build and what the world looks like. But it’s kind of a simple math of each of those wafer fabs is probably $5 billion or $6 billion of revenue annually, probably closer to the 6, depending on what we’ve got inside of it.
On the other hand, Intel is growing a whole new segment with its ambitions to get into the foundry business, which is currently under $1 billion in revenues. Meanwhile, the market leader TSMC (TSM) generates around $65 billion in annual revenues. Intel’s investments have a much lower certainty and much higher risk. Below you can see how Intel’s balance sheet has deteriorated over the last two years since it started its investment cycle: Cash declined, Debt increased, FCF collapsed due to high CapEx, Dividends keep rising (financed by which cash flows?) and the shares outstanding increased for the first time in many years after buying back aggressively for a long time. On the other hand, TI can easily pay its increased CapEx out of its cashflows. CapEx of $3 billion compared to $9 billion of Operating cashflows. This leaves $6 billion for a growing dividend (currently $4.2 billion annually) and opportunistic repurchases.
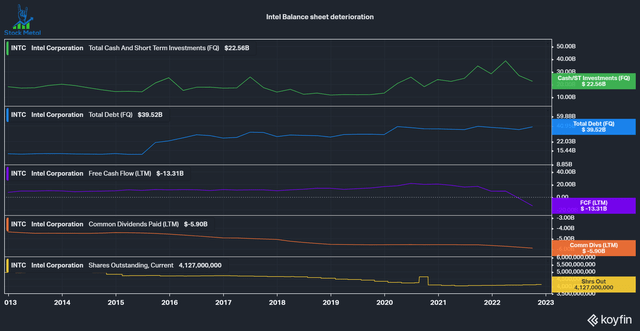
Intel Balance Sheet Deterioration (Koyfin)
Intel also has been an aggressive repurchaser of shares over the last decade, spending $65 billion (more than half of the current market cap) to retire 17% of shares outstanding. These buybacks have destroyed a lot of shareholder capital and could have been paid out as dividends or to increase the company’s competitive position.
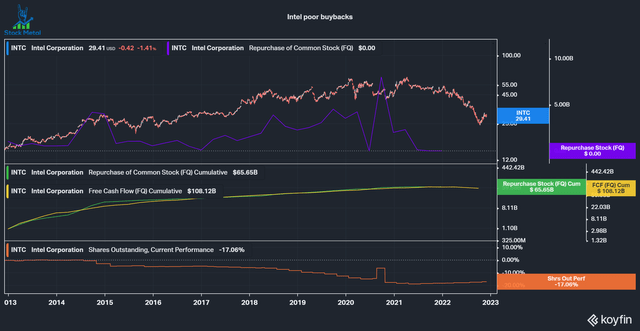
Intel’s poorly timed buybacks (Koyfin)
Texas Instruments, on the other hand, only repurchases shares in opportunistic times when shares are trading below intrinsic value, according to CFOs DCF analysis. TI retired 19% of its shares in the last ten years, spending 16.7% of the current market cap on buybacks. Note the spikes in the correction in 2018 and during the Covid crash and the reluctance to buy back during the manic bull market in 2021.
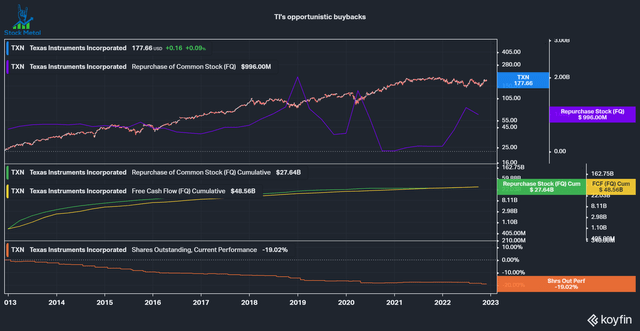
TI’s opportunistic buybacks (Koyfin)
Intel isn’t cheap
Intel Bulls often talk about the low PE ratio, but that really isn’t the case anymore if you look at the estimated forward PE ratio. Due to Intel’s collapse in profits, the company is not cheap and trades significantly above its ten-year median forward PE ratio of 12.9 times. On the other hand, TI trades around its ten-year median after being overvalued during 2020/2021 with PEs in the 30s. Of course, if Intel manages to turn the business around and bring profits back to the levels they were in 2020, then the stock will be very cheap. I believe their heavy investments in the foundry business will keep profits low for a while and the investments have a decent risk of not turning out well. I would instead buy Texas Instruments, a higher quality company with much better management, at a fair price. Texas Instruments is a top 3 position for me with a 10% allocation in my concentrated portfolio.
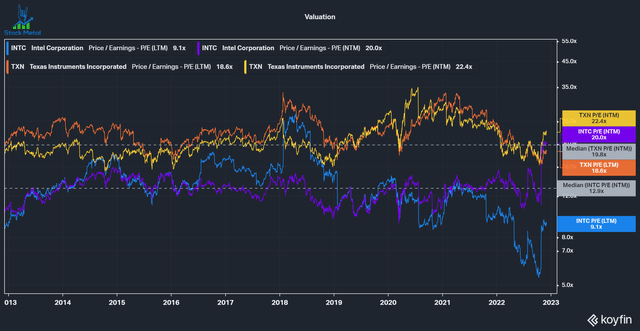
Valuation comparison (Koyfin)
What do you think of Intel and Texas Instruments? Let’s continue the discussion in the comments below.